Standard Workloads aggregate your operational entities into a single, cohesive view to help you monitor performance and understand overall service health.
Summary page
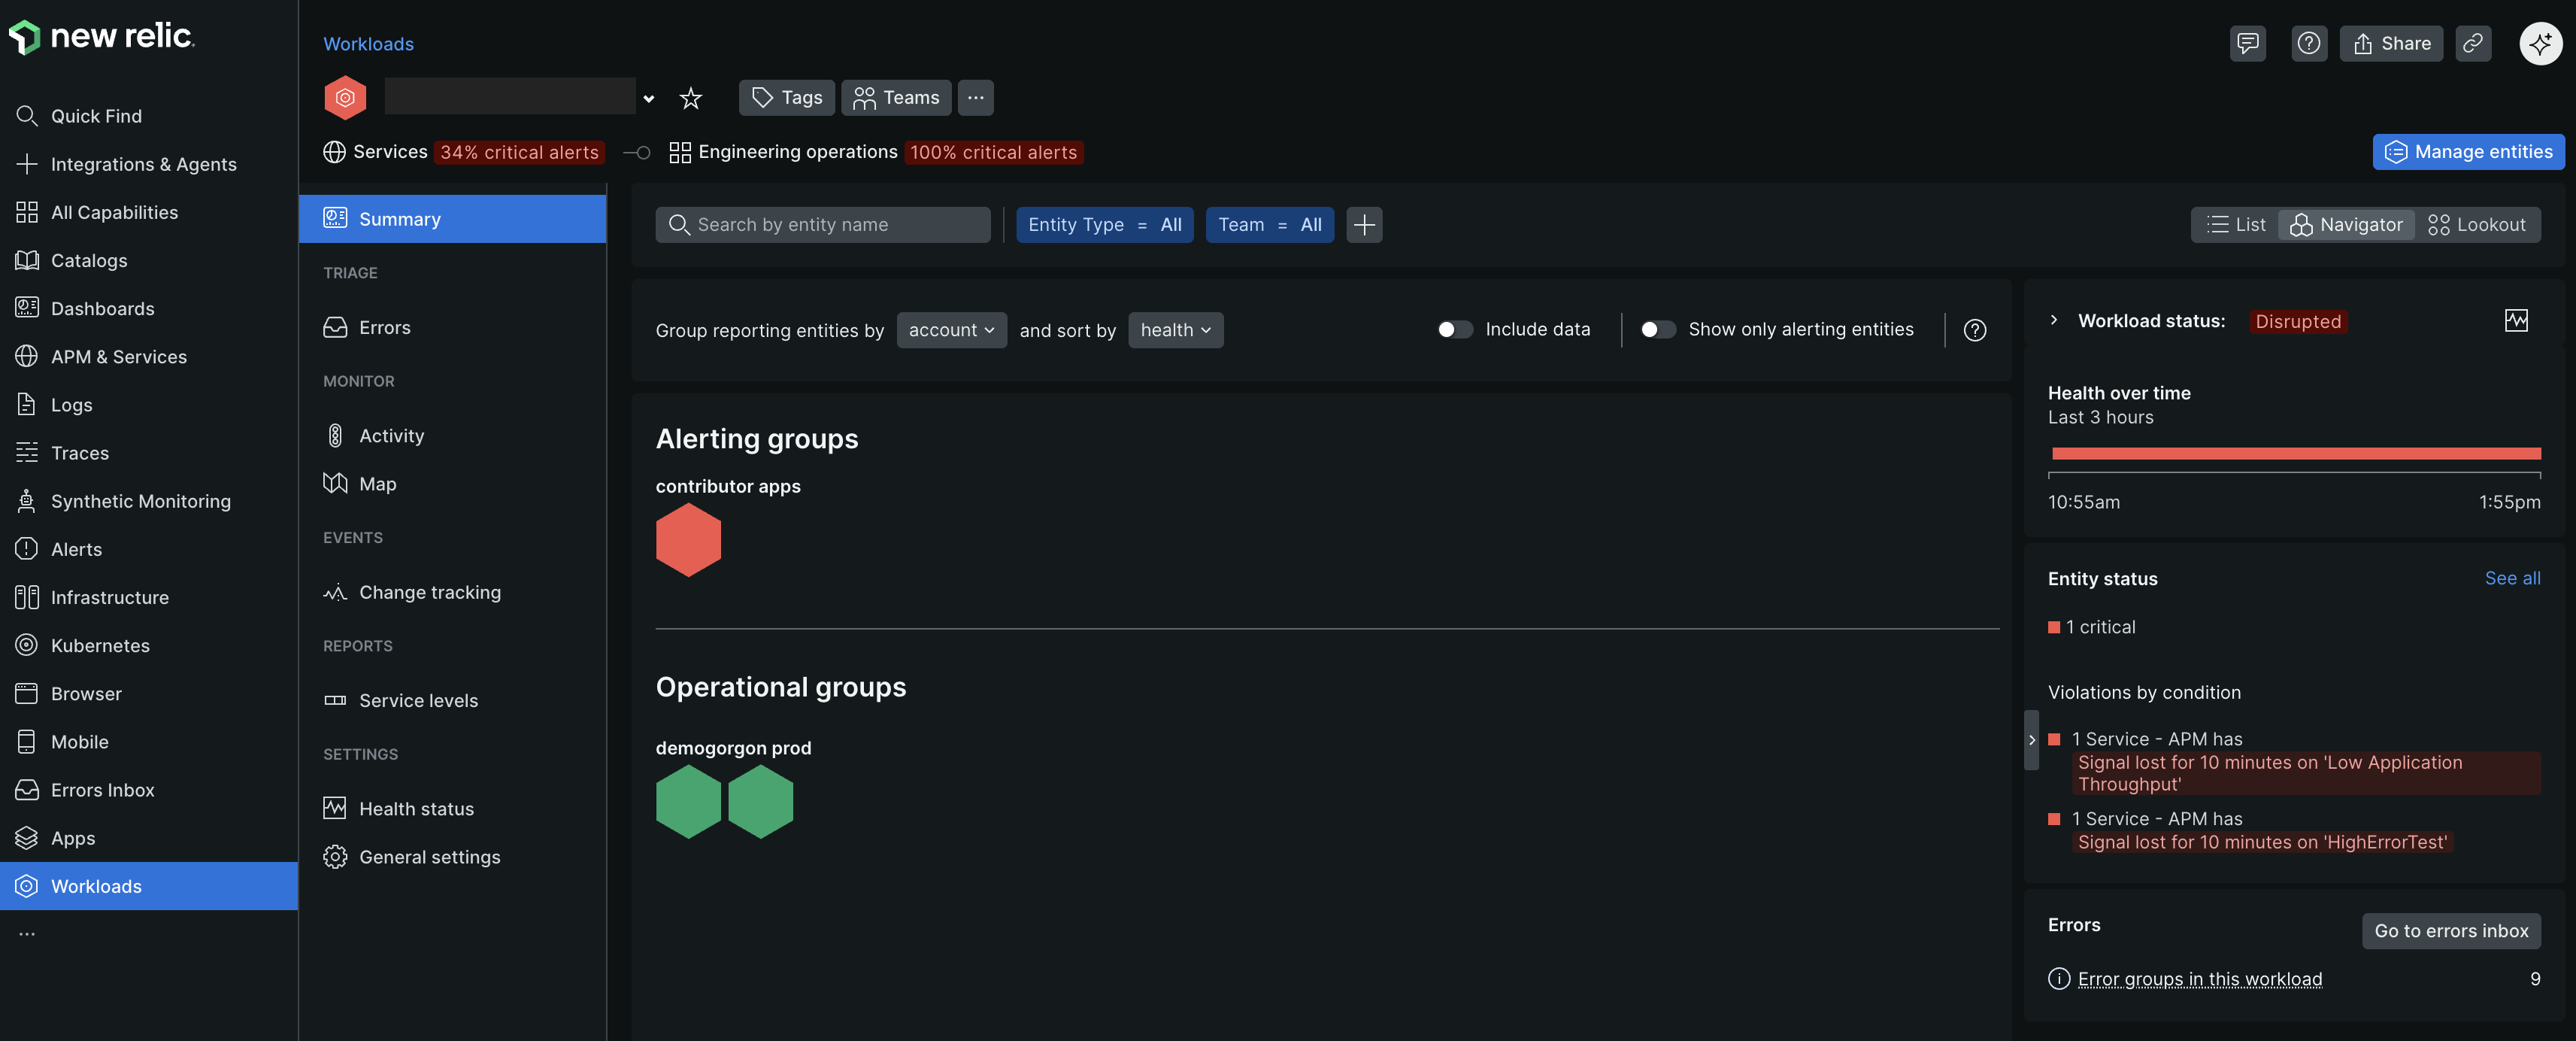
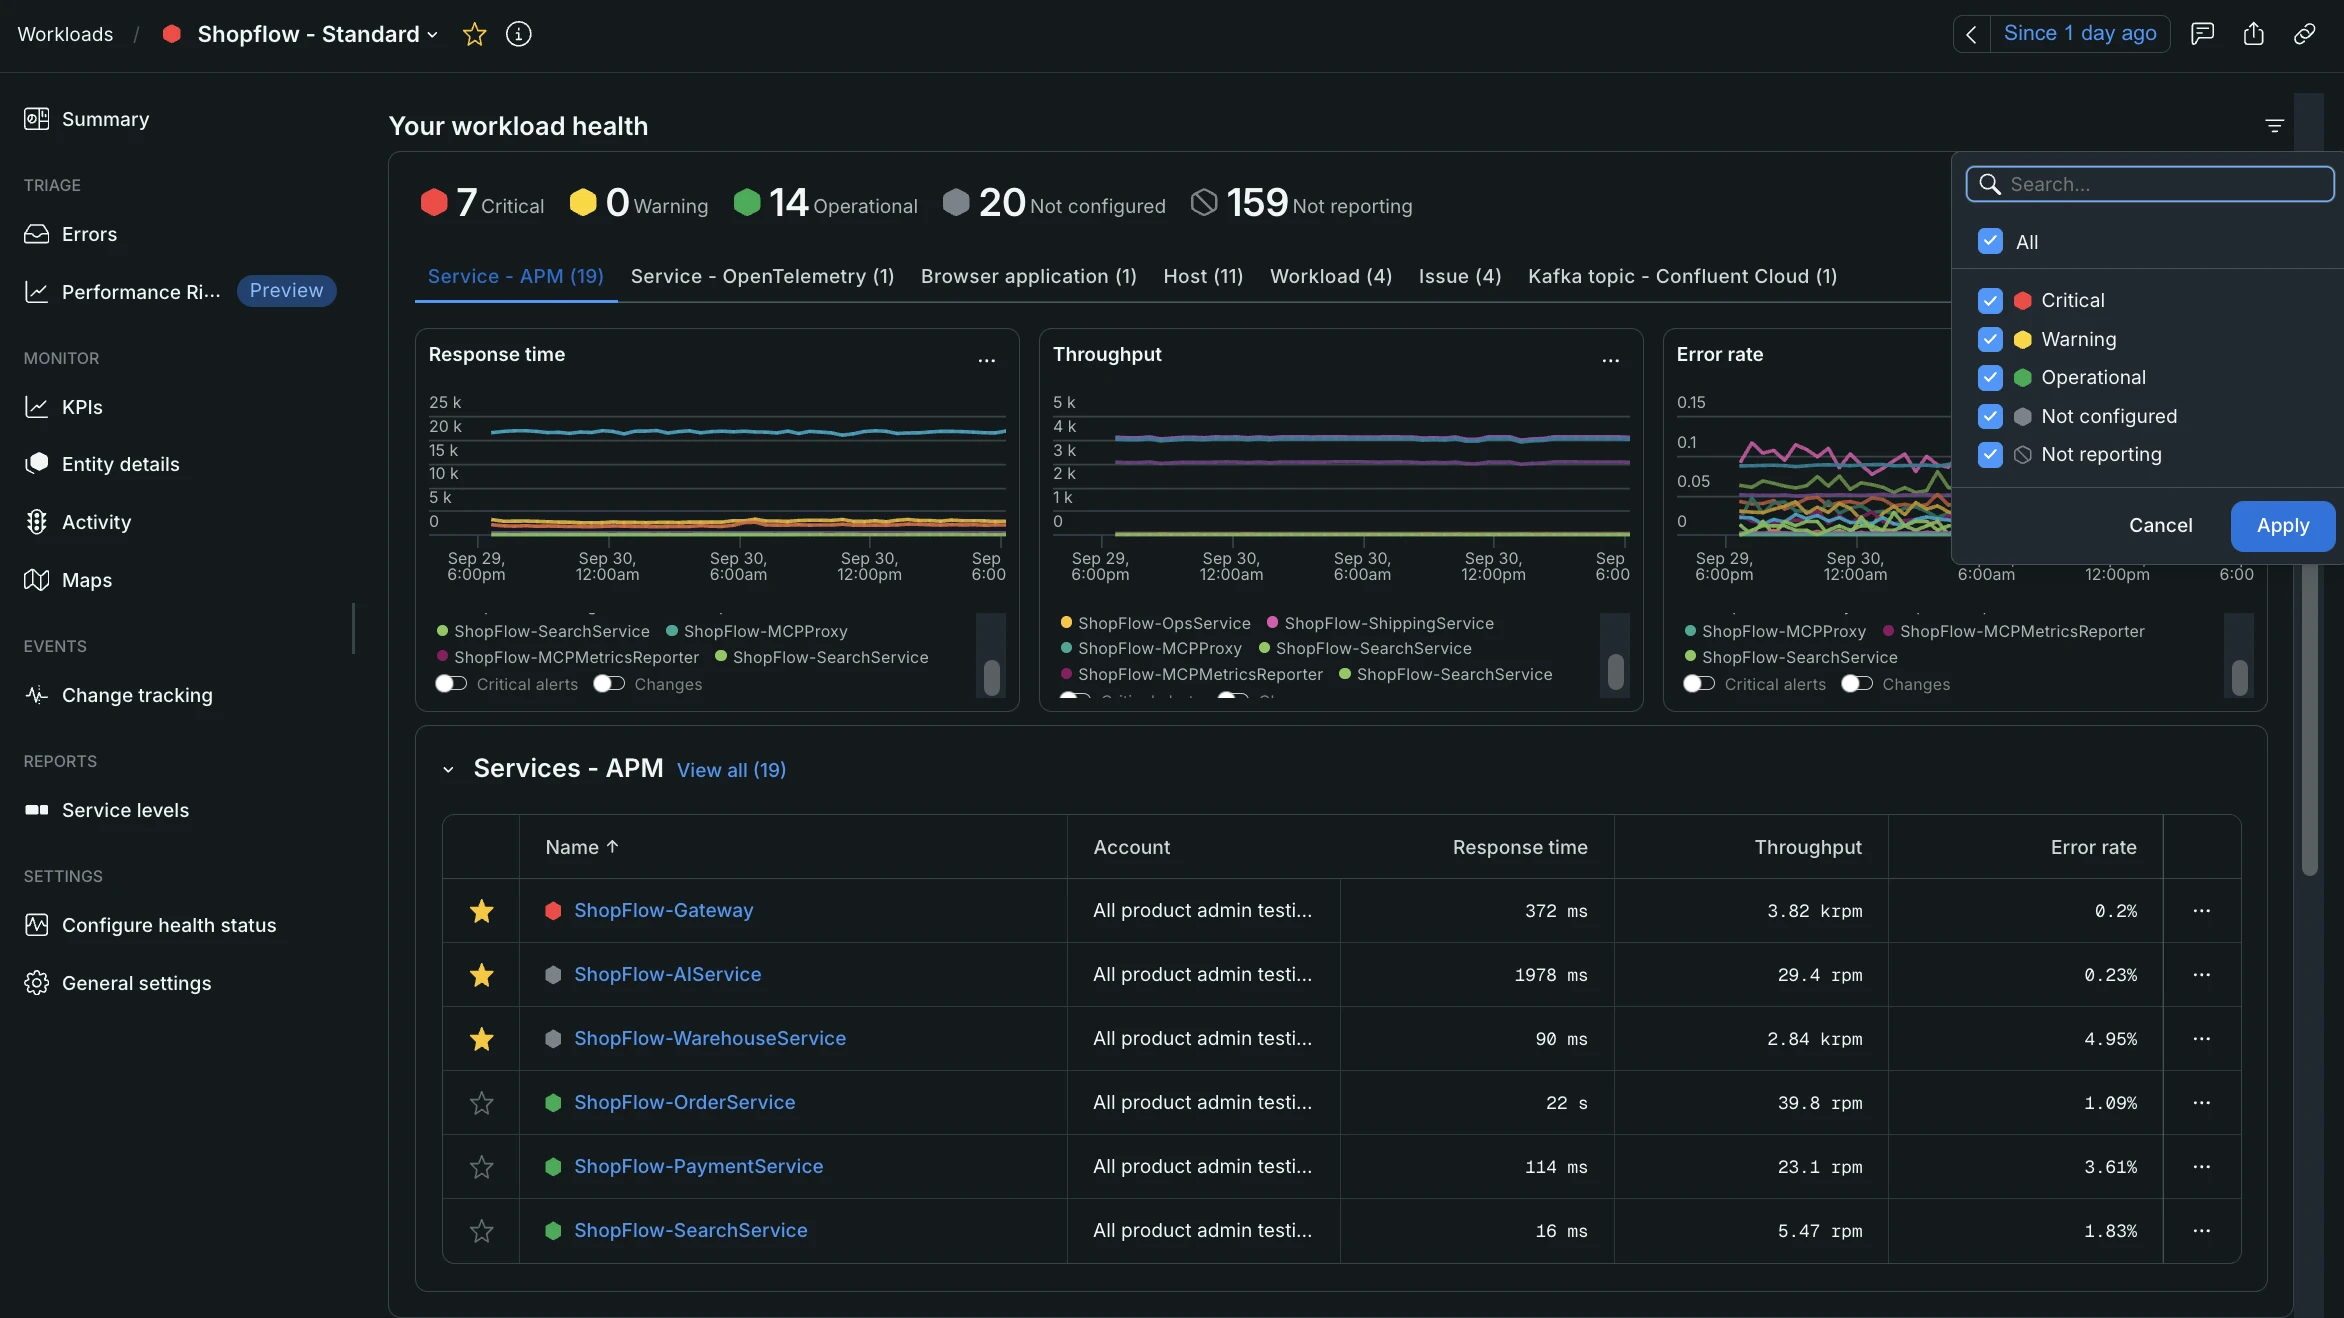
The Summary page serves as your central operational dashboard, combining real-time workload health metrics, recent changes, and performance telemetry in one place. It gives you immediate visibility into active issues and helps you quickly correlate disruptions across your entire stack.
Navigating the Summary page
We recommend starting with the What's changed timeline when a workload status changes to see if recent deployments, error group spikes, or alert activity correlate with performance shifts. For example, if you notice an error group spike on the timeline, use the health filter to isolate entities in Critical or Warning states. Next, check the aggregated golden metrics for those critical entities to verify if their error rates spiked alongside that event. Following this path helps you narrow down what is driving the health change before you select a specific entity to drill down further.
Save views of multiple workloads
If you often need to see the status of a certain group of workloads, you can save views that contain only those workloads.
To create a view:
- Go to one.newrelic.com > All capabilities > Workloads.
- Click on the
Edit viewicon. - Give the view a meaningful name (such as the name of a team or business unit), and select an account to associate the view with.
- Select the workloads you want to include in the view, by their name or tags.
Status views are most useful for teams that are accountable for more than one workload, support roles, and business unit managers.
Errors
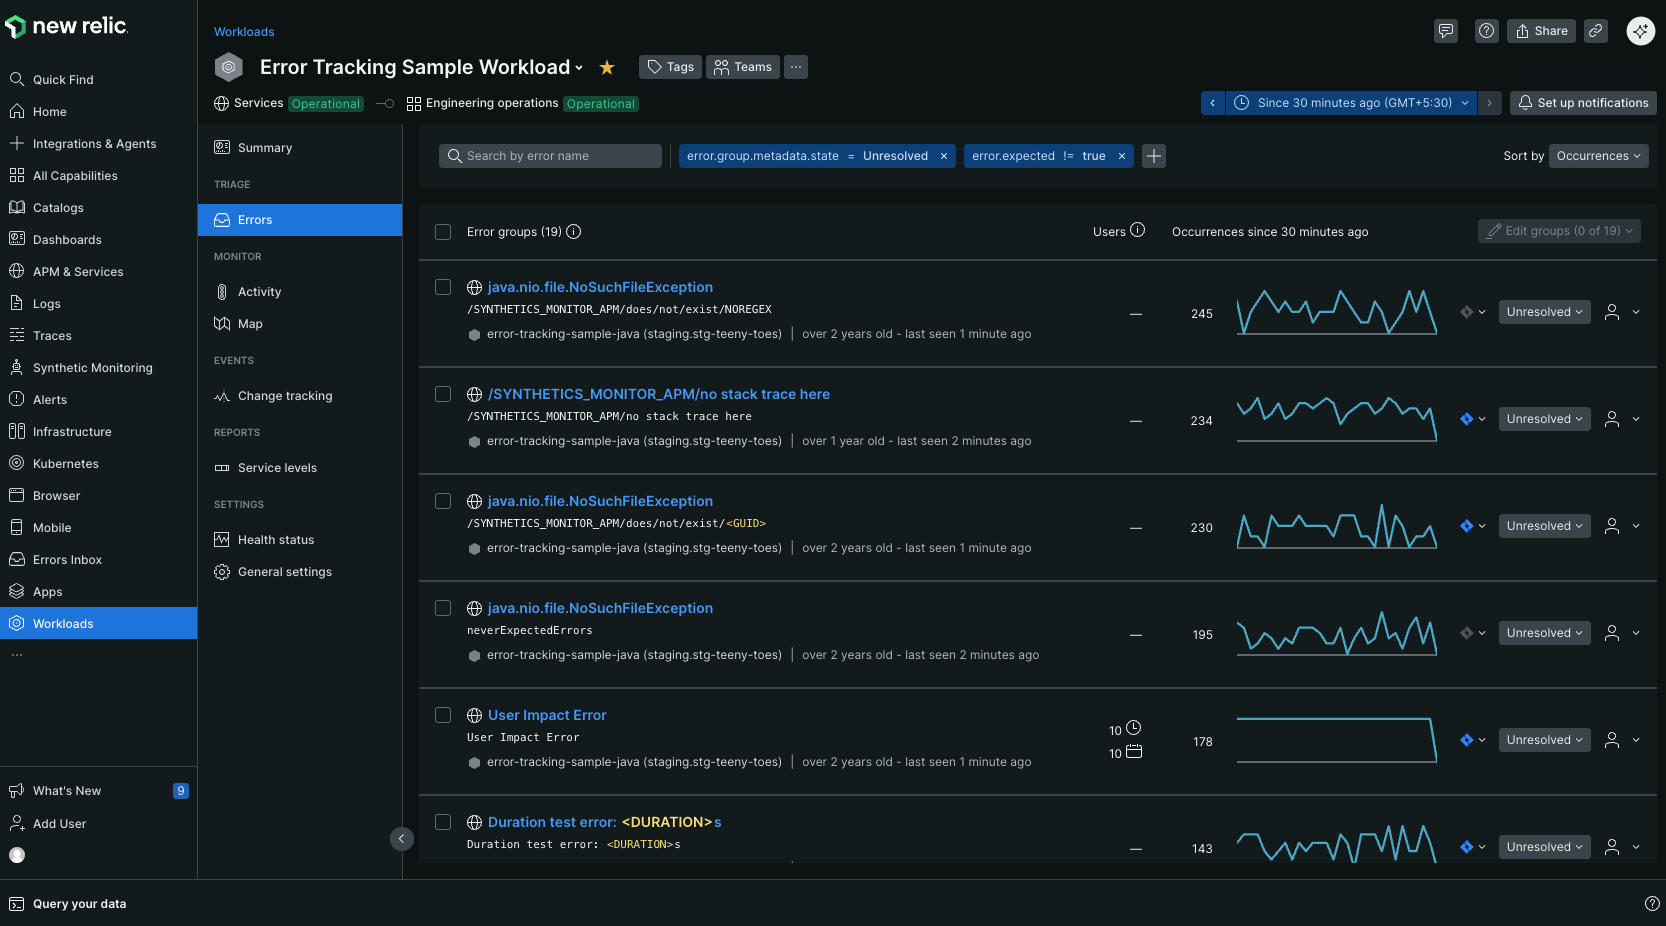
The Errors page provides insights into the error rates, count, and types of errors occurring in the workload. It helps you identify problematic areas and prioritize fixes. For more information, refer to Errors inbox.
Performance risks
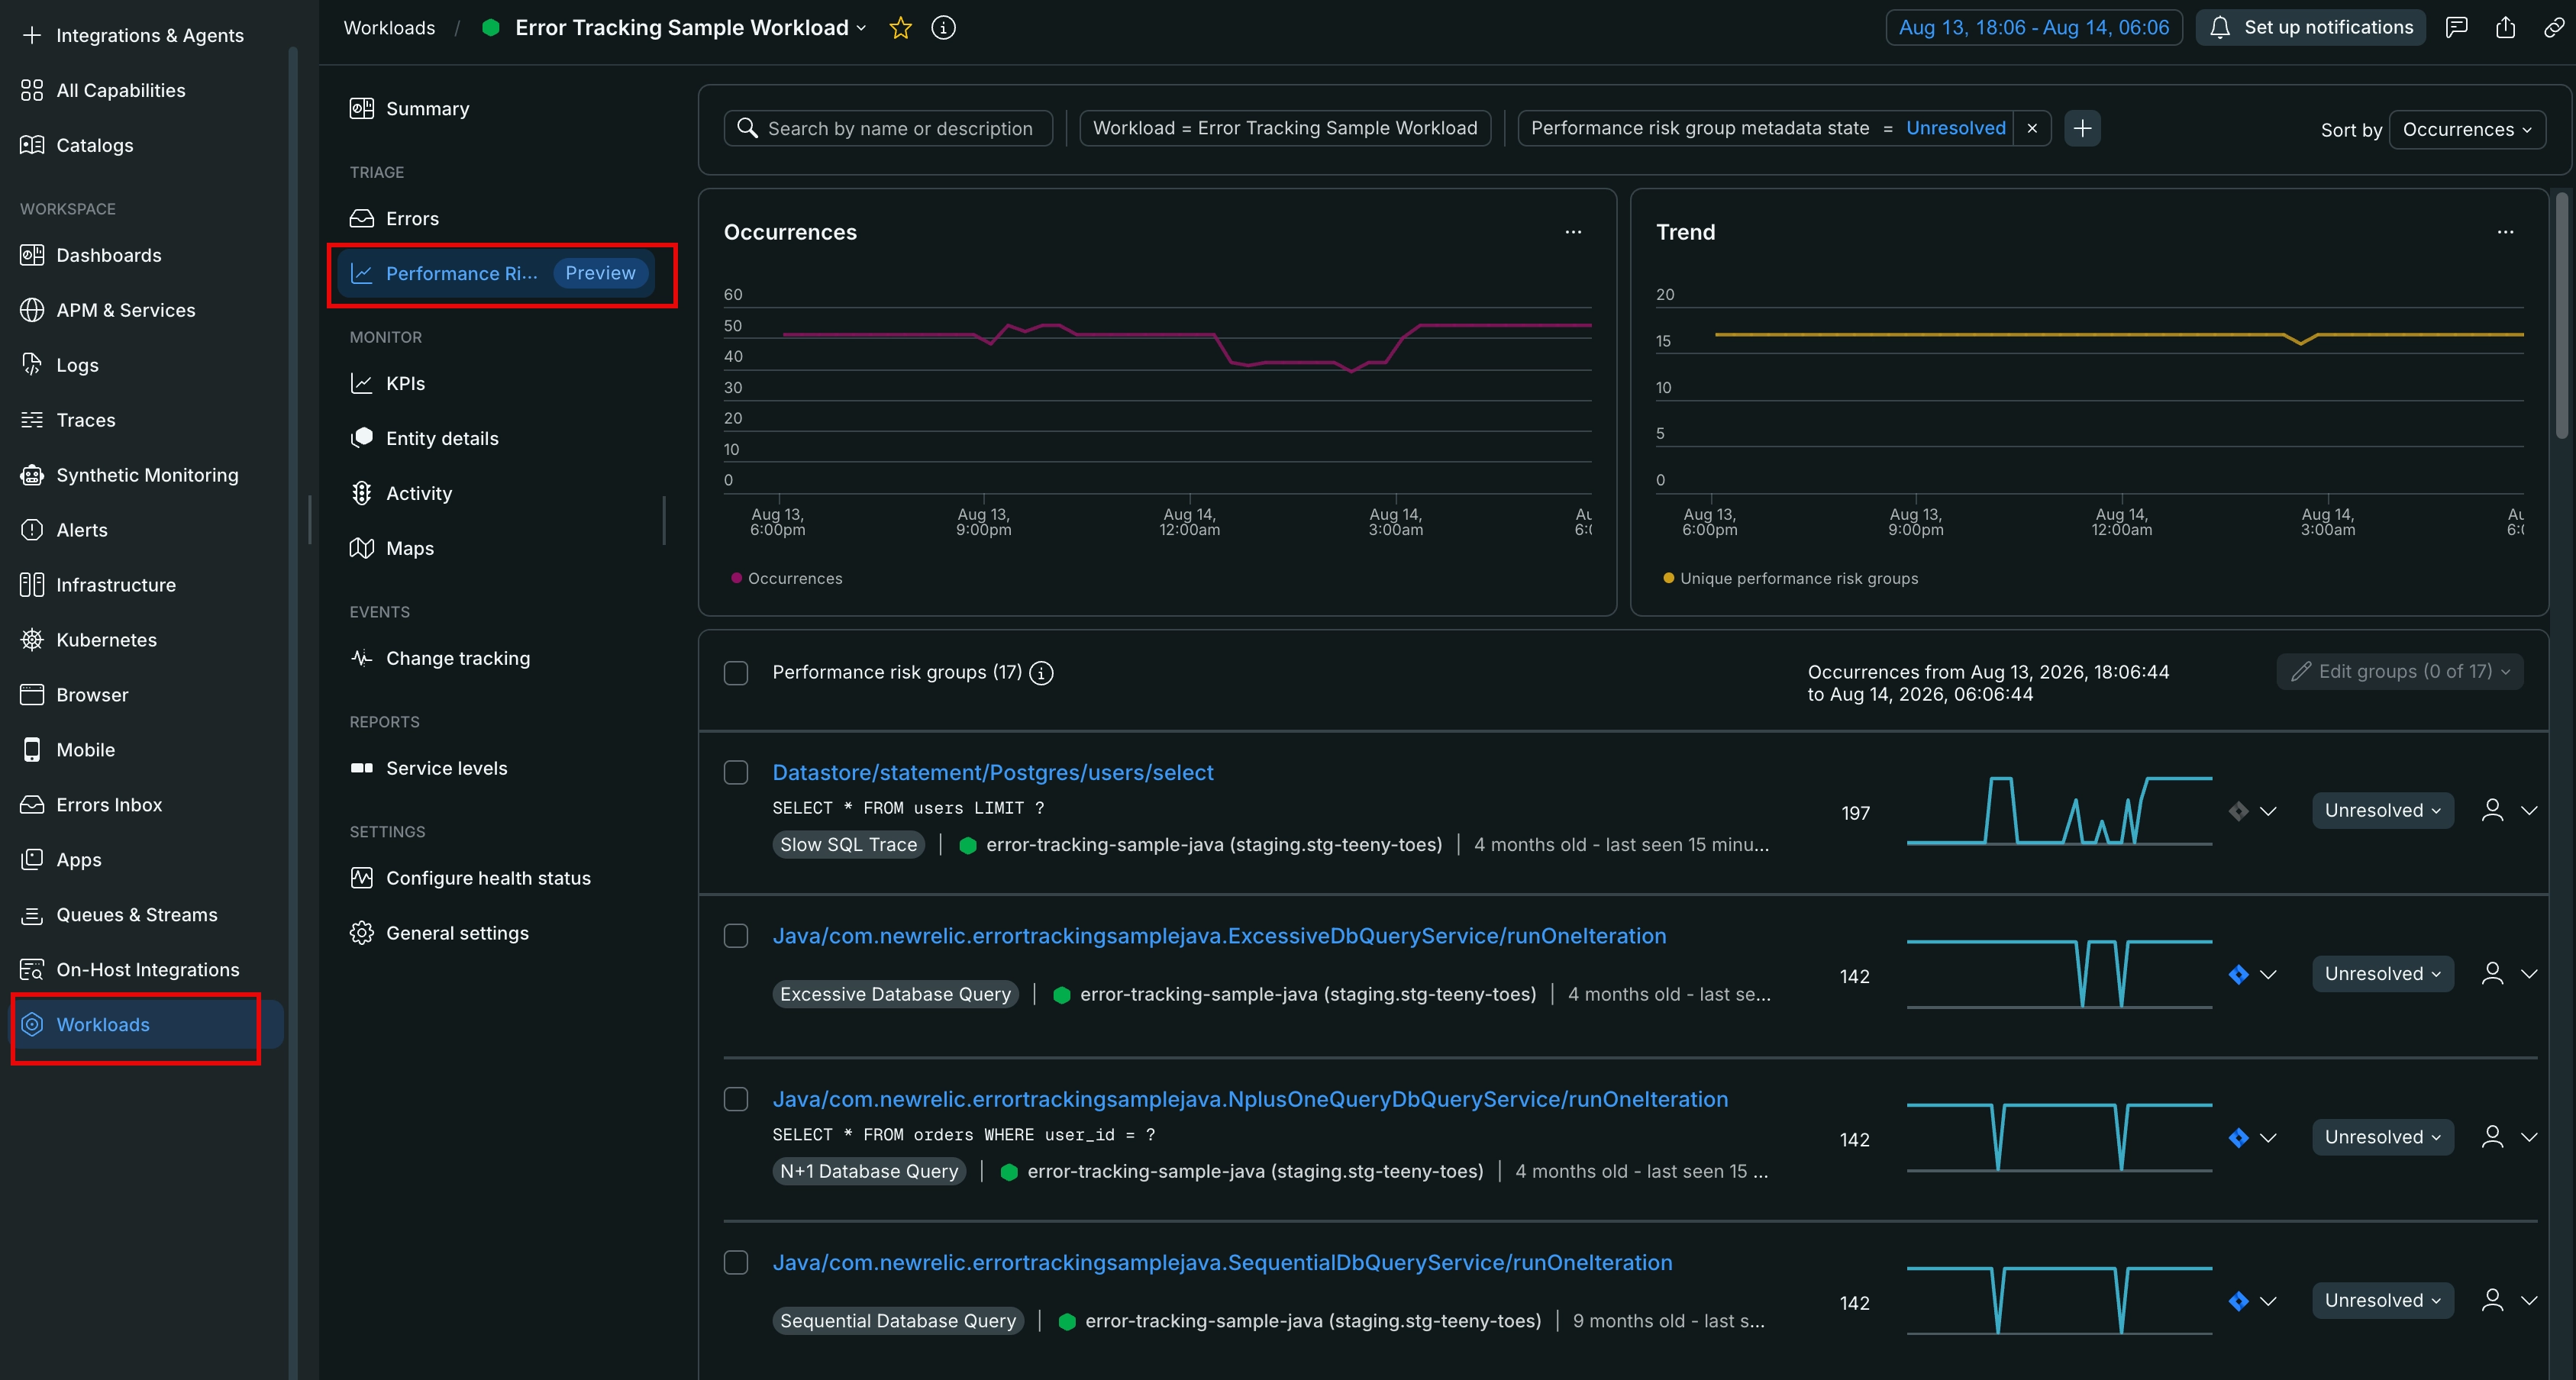
The Performance risks page shows performance risks detected across the entities that make up the workload, so you don't have to check each entity individually. For more information, refer to Performance Risks inbox.
Activity
The Activity page shows performance data related to the entities in the workload, along with the events that could explain any changes in those time series.
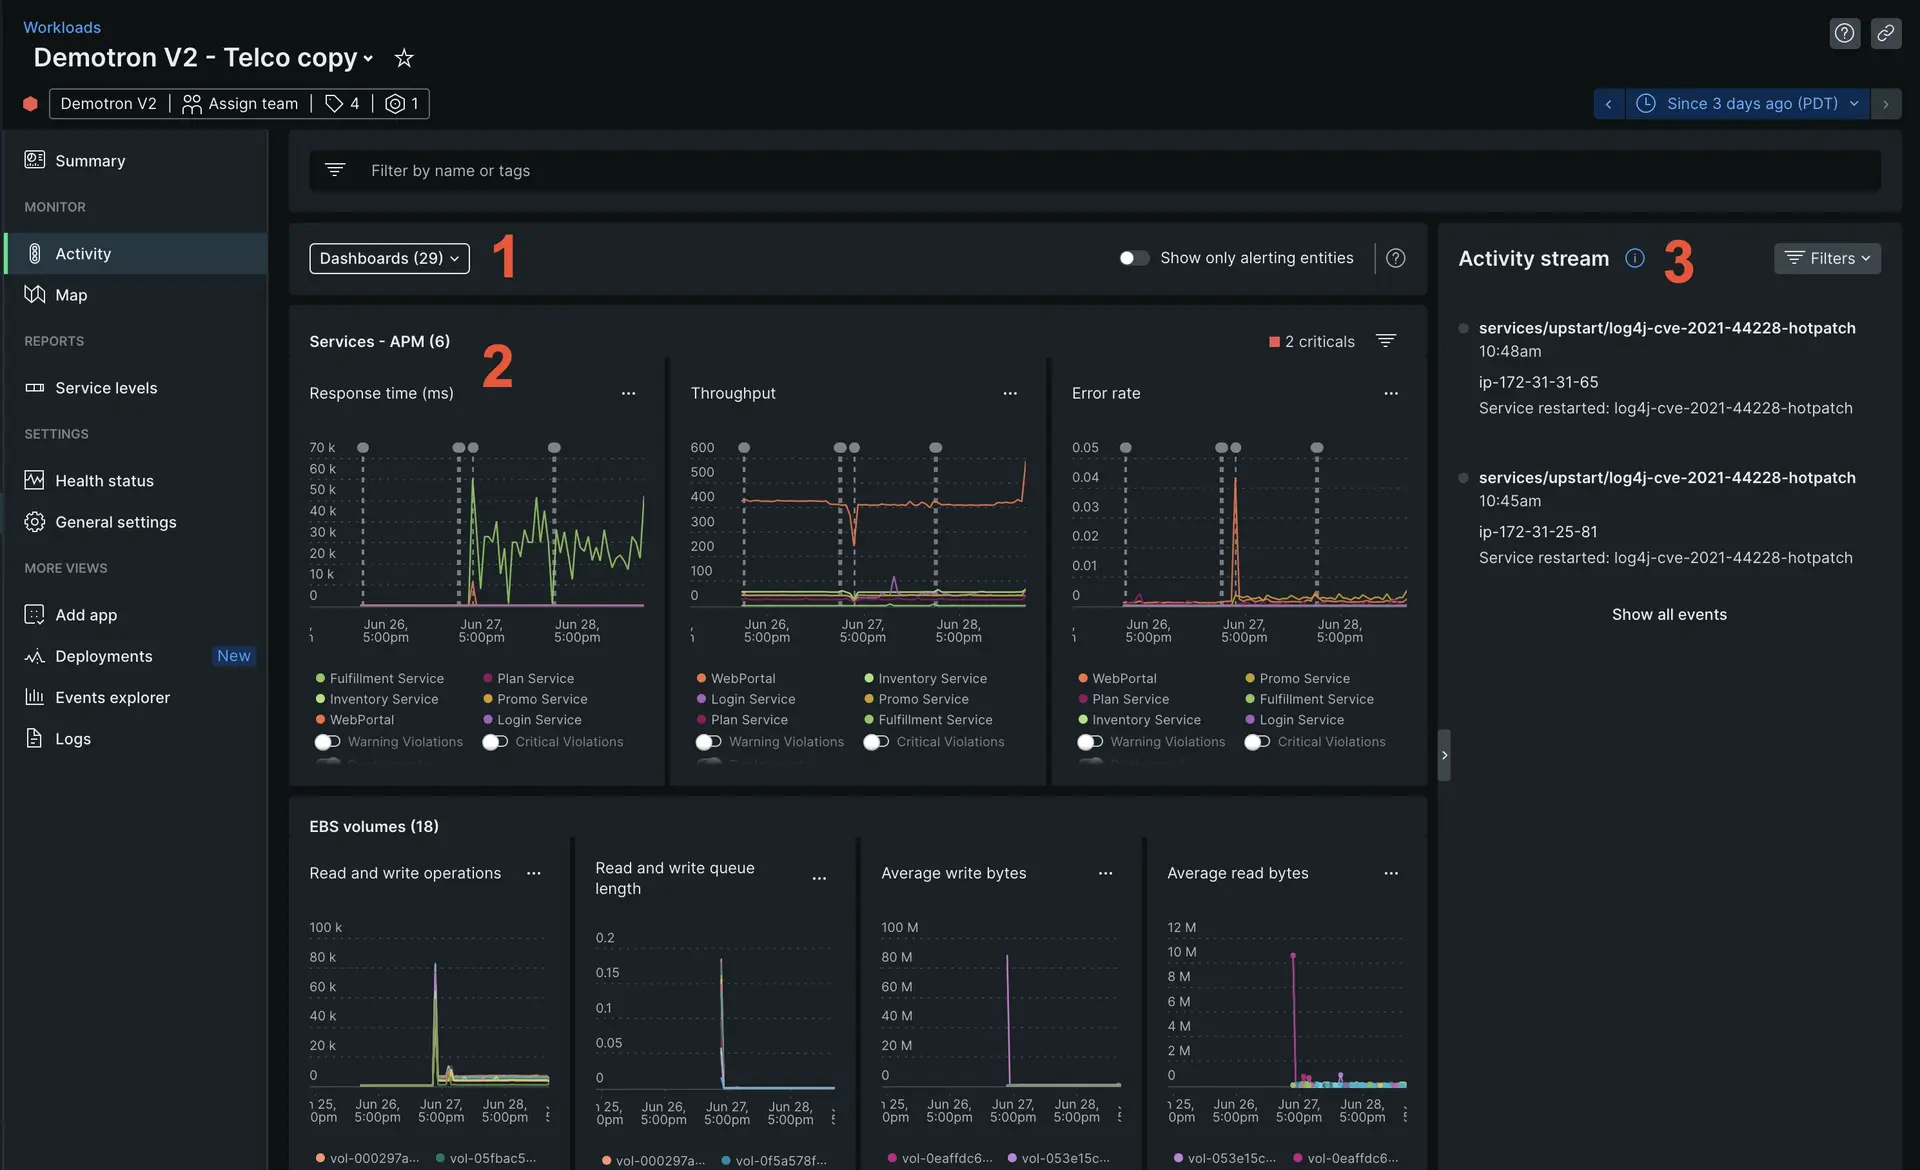
Here are some of the most important sections:
- Linked dashboards. From here, you can add related dashboards to your workloads, including links to pre-filtered dashboards.
- Golden metrics. These are charts with the most relevant metrics for each entity type. Explore the charts to detect correlations among different entities (for example, two applications) and different stack layers (for example, applications and hosts). The metrics you see can be customized either at the account or the workload level through our NerdGraph API.
- Activity stream. This includes the start and end time of incidents and anomalies that refer to the workload entities. It also shows other event types that can explain a change in the status or performance of the workload, such as deployments and configuration changes.
View workloads maps
You can view a map that displays how the entities in your workload relate to and affect one another.
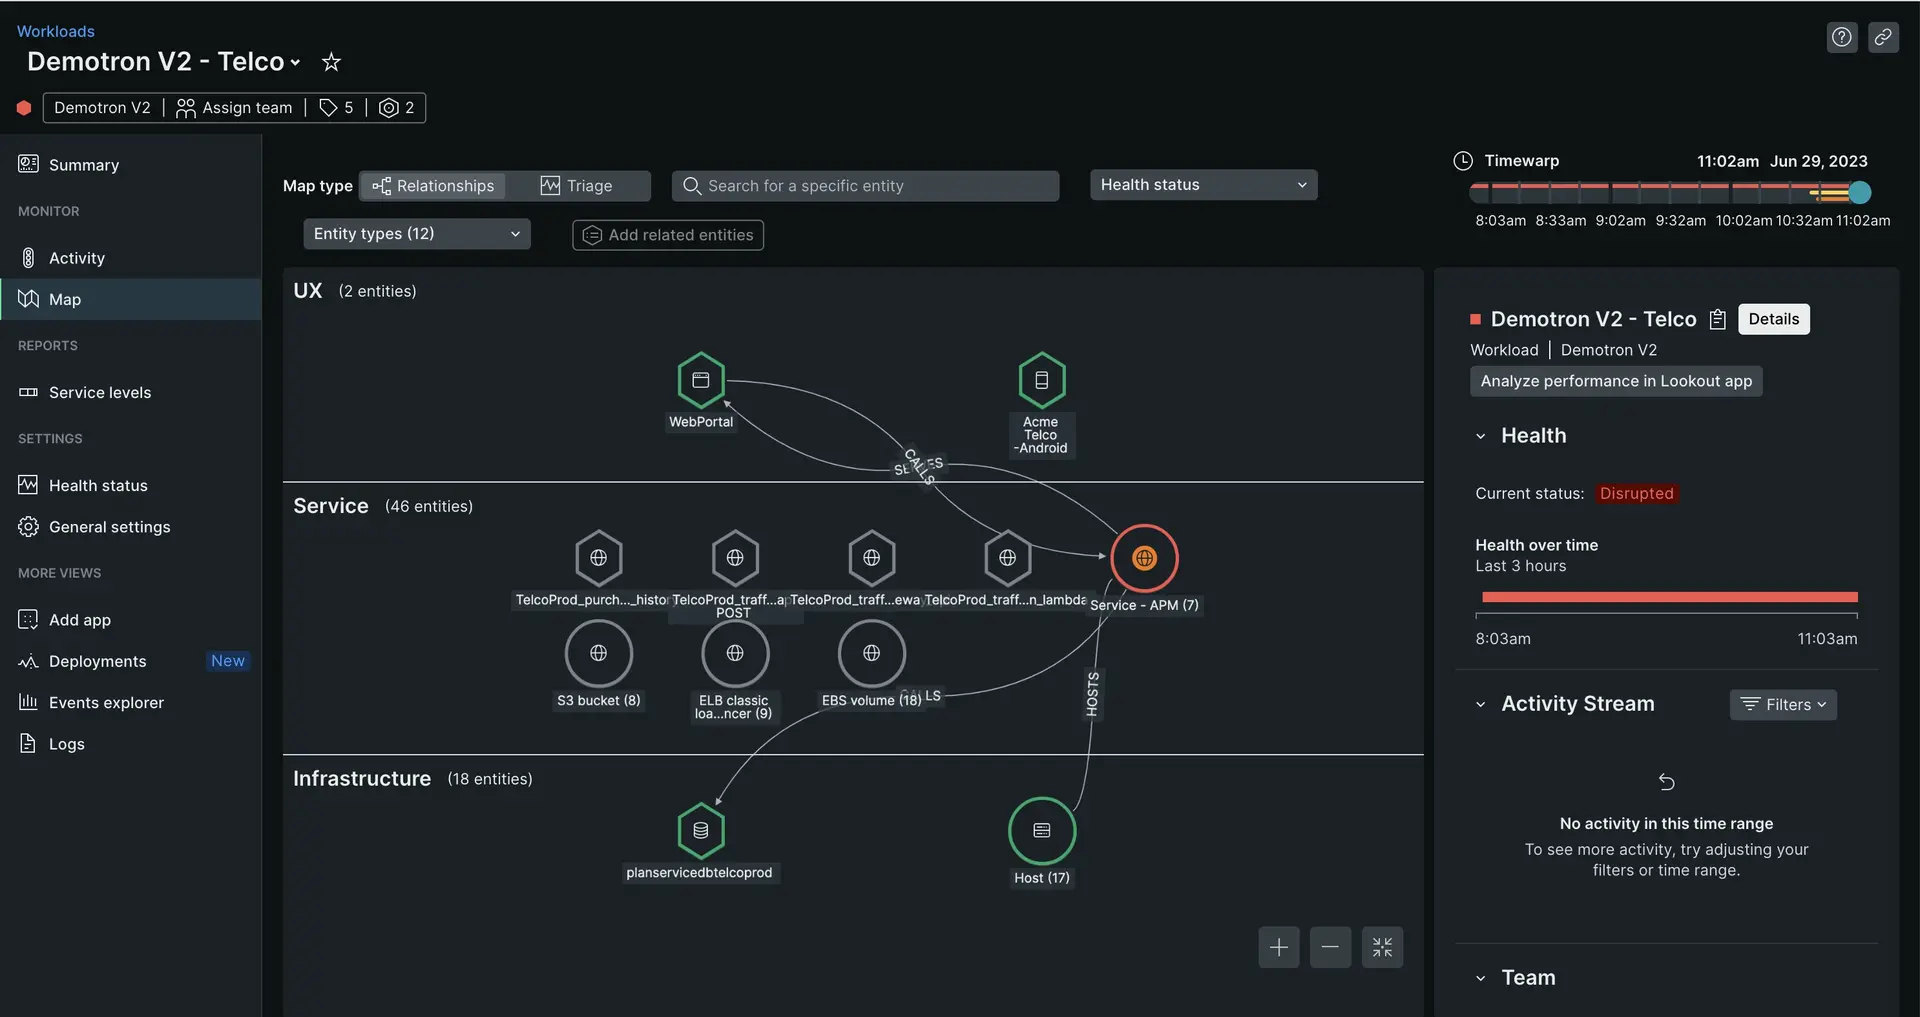
To learn more about this map, see Maps in context.
Health status
For details about this page, see Status configuration.
General settings
The General settings page gives you information about the team responsible for the workload. It contains:
- The team responsible for the workload. You can include more than one team.
- The workload description. Share the purpose of the workload, and the business logic it represents: Is it a web application? An API? A backend process? Fill in details relevant to your team, or to other teams in your organization.
- Contact information. From the drop-down menu, choose how your team prefers to be contacted.
- Links to the most relevant resources to operate the workload. Here you can add links to runbooks, code repositories, productivity tools, or anything else.